Here are the presentations from Round 18!
Aaron Schumacher
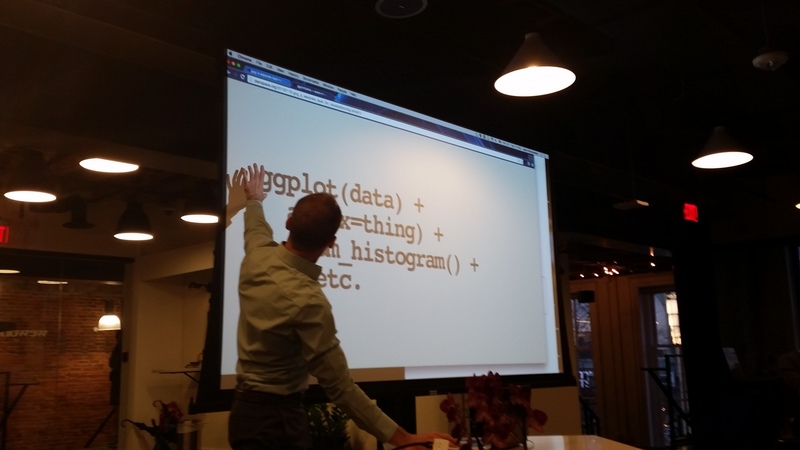
This was Aaron’s last hack and tell with us… :( GOG: Why can’t plotting data be as simple as it is in R with plot(data)? The interface should be simple, the complexity should be handled automatically behind the scenes. Unfortunately with R, the graphics generated are static and not interactive. This leads to multiple separate ecosystems with graphics. GOG allows you to visualize any data from any language / tool (R/Python/etc) GOG is gateway / intermediary. Goal - language independence. Also allows for interactivity of data plots within R! yay Cool things also used: http://www.charted.co (live data from any data source / gSheet).
GOG code lives at: https://github.com/ajschumacher/gog
Anna Petrone
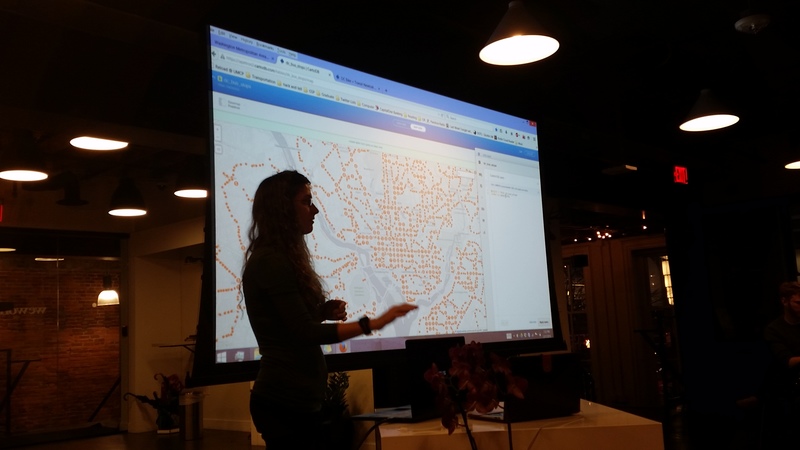
Bikeshare is great at the “last mile” of short-range trips. It’s easy to connect bikeshares to the metro – but how can we serve bus riders in a similar way? Where are the bus hotzones and where you might want to best put a bike share? Uses the WMATA APIs to pull bus route information and schedules
First, I plotted all of the stops onto a map but it wasn’t very helpful. Next, I looked at every stop and counted how many buses would be stopping per day. Finally, I used cartodb to overlay the bus data onto a map of DC to visualize the data in an interactive way that allows layering for Bikeshare stations vs Buses
Q: How to improve the map? Look into dot density mapping. Or use carto’s built in SQL queries to aggregate data.
Sonia Hinson
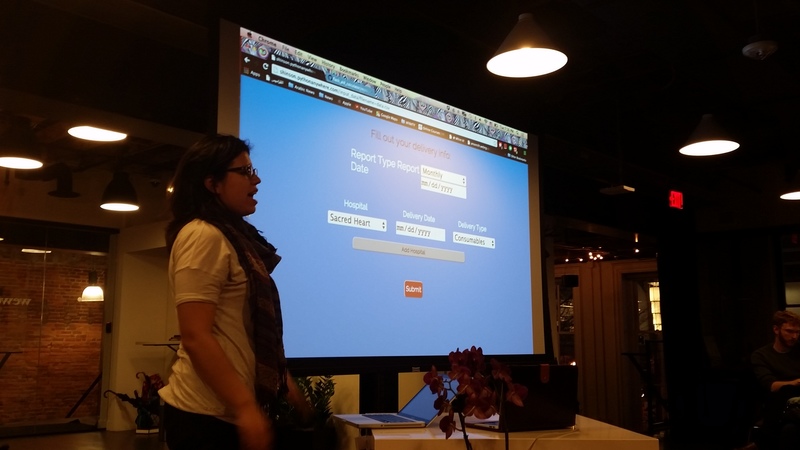
Flask website for medical relief calculator. Built a webapp using Python and Flask to track humanitarian aid for emergency medical relief. Uses Javascript to repeat the forms to add extra hospitals. Code lives at: https://github.com/shinson/flask_aid_calculator. Yay for http://hearmecode.com.
Libraries and things used:
https://github.com/wtforms/wtforms
https://www.pythonanywhere.com/
Rick Spencer
Ubuntu (VP of Engineering) Ubuntu phones! They should have apps!
Wrote an (five-star rated!) app for Ubuntu OS, getthereDC in QML that works on Ubuntu phones, tablets, and desktop.
Geolocation by https://www.here.com/ (history of it b/c why not)
Jess Garson
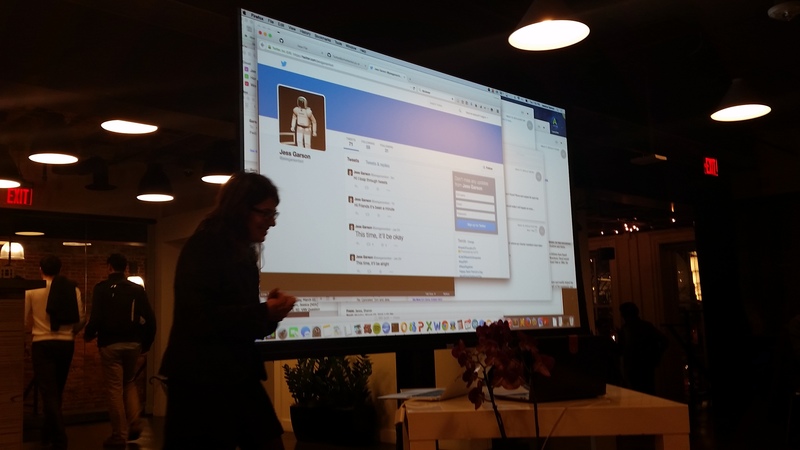
Sings songs and whatever file you pass it.
Also wrote another app that looks at instances of where Jess Garson / @jessicagarson shows up.
Code: https://github.com/JessicaGarson/TwitterBot/ Follow @JessGarsonBot on Twitter.
Travis Hoppe
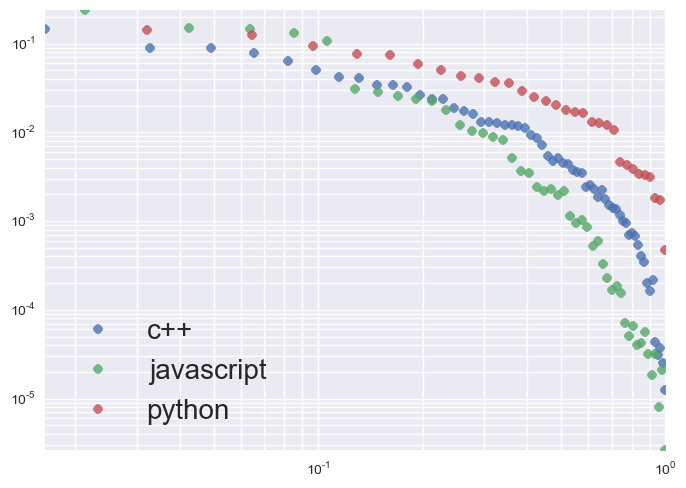
Zipf’s law of word frequency: Frequency vs rank order of Wikipedia corpus follows three power laws. Does this linguistically hold for code as well (with Github?) ~ 12 million public non-forked repos. Created a small army of AWS clones to grab this with the 5000 requests limit / hour. Downloaded the top 1000 repos for C++, Python, Javascript, serialized by md5 for uniqueness. Power laws are everywhere: forks, stars, subscribers, and size! But what is code? No comments, no strings. Only keywords, literals, variables, and constants. Spoiler: code does follow a power law – keywords don’t!
Presentation lives at: http://thoppe.github.io/code-linguistics/HnC_presentation.html#/
Project lives at: https://github.com/thoppe/code-linguistics
Richard Barnes
![]()
Certificates have terrible user experience. Let’s Encrypt is creating a new Certificate Authority
- Free: 501c3 funded by industry
- Automatic: One click to turn on HTTPS
- Open: Open source
- Q2 2015 Issuing Certs!
Code lives at https://github.com/letsencrypt
Built With: Node (for hacking things), Python, Docker, Go (Go / Docker = building the CA) 2 mins to HTTPS! Yay!!
Michael Schade

GeoGIF: Making animated GIFs with Google Streetview
Can I use Google’s API for Streetview to make a movie out of Streetviews? Turns out, Google’s API is easy to use and all of the parameters are right in the URL. I created a tool in Javascript to create a GIF out of the street view images Step 2: Use Google directions API to get street view around that.
Code lives at: http://mvjantzen.com/tools/geogif.html
Presentation at: http://mvjantzen.com/tools/geogif/demo.html